How do I use the Income & Expense report?
The Income & Expense report type is used to analyze the cash that flows in and out of your accounts based on the categories assigned to your transactions. It is the easiest way to track trends in specific categories, and to see if you are earning more than you spend in a given period of time. iBank's Income & Expense report includes pie charts that show breakdowns of your income and expenses by category, a bar graph that shows your spending over time (cash flow), and a table of income and expense totals by category.
Create an Income & Expense report
-
Choose a report type:
Click the plus (+) button on the toolbar and choose "Add Report," or choose Tools > Add New Report. iBank will ask what type of report you want:
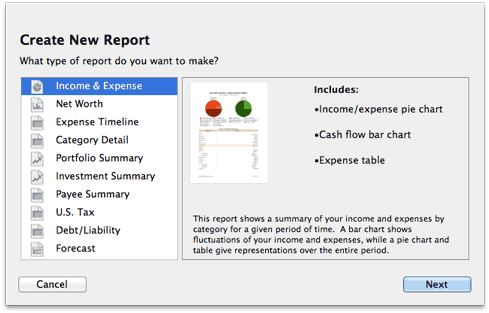
Choose "Income & Expense," then click "Next" to continue.
-
Choose accounts:
This screen lets you define the scope of the report by choosing which accounts are included. Using the popup menu at the top of the screen, choose one of the following options and configure its settings accordingly:
-
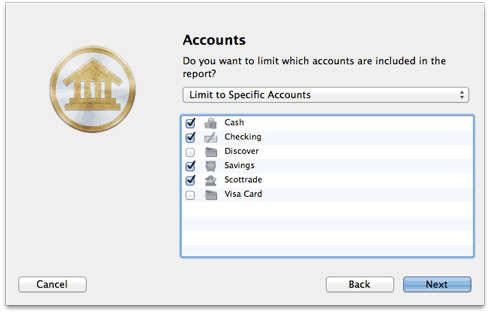
Limit to Specific Accounts:
By default, new Income & Expense reports include all accounts, whether or not they are hidden. If you want to limit the report to certain accounts, choose this option from the popup menu button and check off the accounts you want to include. When no accounts are checked, all accounts are included in the report.
-
Limit to Accounts Using Smart Rules:
To limit the report to certain accounts based on dynamic criteria, choose this option from the popup menu button. You can then configure a series of rules that define which accounts are included in the report:
- Any/All of the following are true: If you choose "Any" as the option for this rule, all accounts that match at least one of the rules that follow will be included in the report. If you choose "All," only accounts that match all of the rules that follow will be included. The first instance of this rule cannot be removed. Additional "Any/All" rules can be added by holding the Option key and clicking the '...' button next to one of the existing rules. This will allow you to create more complex rule hierarchies.
- Group: Use this rule to include or exclude all accounts in a particular account group.
- Debit: Use this rule to include or exclude accounts of the following types: Credit Card, Line of Credit, Liability, and Loan.
- Currency: Use this rule to include or exclude all accounts that use a specific currency.
- Account type: Use this rule to include or exclude all accounts of a particular type.
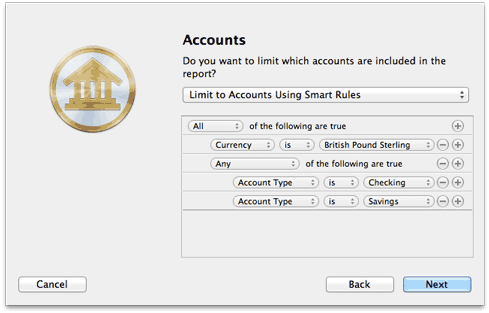
The advantage of using rules instead of checking off specific accounts is that the report will automatically update itself to include all accounts that satisfy the rules you set up. To illustrate, say you create a report to track only your assets, by using a rule that excludes all loan, credit, and liability account types. Once the report has been created, you can add and delete accounts as needed (of any type), and the report will always show all of your asset accounts.
Account transfers are only counted in Income & Expense reports when one of their associated accounts is included but the other account is excluded. When both accounts are included, the transfer is considered to be internal and does not count as either income or an expense. Only when one of the accounts is excluded does the transfer gain value, from the perspective of the report.
When you finish configuring accounts for the report, click "Next" to continue.
-
-
Choose categories and transfers:
This screen lets you choose which categories and transfers are included in the report. Using the popup menu at the top of the screen, choose one of the following options and configure its settings accordingly:
-
Report on All Categories and Accounts Except:
By default, new Income & Expense reports include all categories and account transfers. If you want to exclude certain categories and transfers from the report, choose this option from the popup menu button and check off the items you want to exclude. Checking a category that contains sub-categories will remove both the parent category and its sub-categories from the report. Click "Toggle All Checkboxes" to check or uncheck all items in the list. When no items are checked, all categories and account transfers are included.
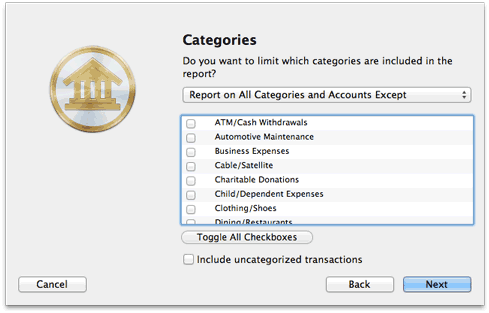
Only accounts that were excluded from the report on the previous screen will appear in this list. Transfers to and from accounts that are within the scope of the report cannot be counted in the report.
-
Report on Specific Categories and Accounts:
To limit the report to certain categories and account transfers, choose this option from the popup menu button and check off the items you want to include. Checking a category that contains sub-categories will include both the parent category and its sub-categories in the report. Click "Toggle All Checkboxes" to check or uncheck all items in the list.
-
Report Using Smart Rule Criteria:
To limit the report to certain categories and account transfers based on dynamic criteria, choose this option from the popup menu button. You can then configure a series of rules that define which items are included in the report:
- Any/All of the following are true: If you choose "Any" as the option for this rule, all categories/accounts that match at least one of the rules that follow will be included in the report. If you choose "All," only categories/accounts that match all of the rules that follow will be included. The first instance of this rule cannot be removed. Additional "Any/All" rules can be added by holding the Option key and clicking the '...' button next to one of the existing rules. This will allow you to create more complex rule hierarchies.
- Parent Category: Use this rule to include or exclude all sub-categories that fall under a specific category.
- Category/Account: Use this rule to include or exclude specific categories or transfers associated with specific accounts. Choosing a category that contains sub-categories using this rule will not include or exclude the sub-categories that belong to it.
- Taxable: Use this rule to include or exclude all categories that are designated as "Taxable."
- Debit: Use this rule to include or exclude all categories that are designated as "Expense" categories.
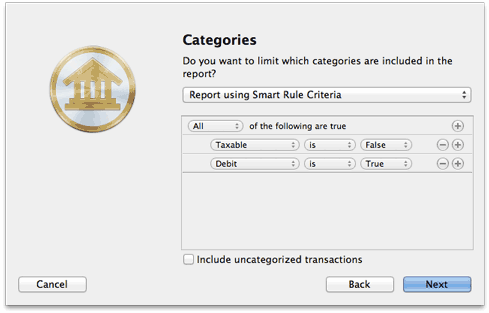
Check "Include uncategorized transactions" if you want to include transactions that do not have categories assigned to them in addition to the transactions with categories included in the report. The uncategorized transactions must satisfy the other report options to be included, e.g. fall within the report's range and be recorded in one of the included accounts. When this option is checked, an item named "Uncategorized" will appear in the charts and tables on the report.
Once you've chosen which categories and transfers to include in the report, click "Next" to continue.
-
-
Choose a date range:
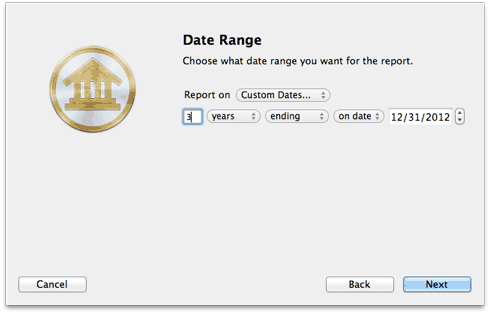
This screen lets you choose a date range for the report. Click the popup menu button and select from a variety of predefined ranges: options that end with "to Date" indicate periods of time that are relative to the current date; other options represent fixed periods of time.
Choose "Specific Start and End Dates" to define an exact range by entering two dates. You may also choose "Custom Dates" to specify a range relative to a particular date. Use the "starting/ending" popup to determine whether the report covers a range of dates in the future or past, respectively. Choose "today" to have the report start or end on the current date (regardless of when the report is viewed), or choose "on date" to specify a fixed start/end date.
-
Finish creating the report:
This screen lets you configure a few last settings for the new report. Enter a unique name to distinguish the report from others in the source list, then pick which currency its figures should be displayed in. If accounts that use different currencies are included in the report, their figures will be converted automatically using iBank's current exchange rates.

Check the "Include scheduled transactions" option to include pending scheduled transactions in addition to the transactions that are recorded in your accounts. The scheduled transactions must satisfy the other report options to be included, e.g. fall within the report's range and be scheduled to post to one of the included accounts. These transactions appear with a yellow background in transaction list reports (see below).
This option can be used to project your income and expenses into the future. To forecast your categories in this manner, be sure the report is configured with a date range that includes future dates.
When you are finished configuring these options, click "Next" and then "Done." The new report will be added to the source list, and the report details will be displayed in the main window.
Edit the report settings
Once a report has been created, you can edit its settings at any time. Double-click the report in the source list, or select it and choose View > Show Popup Inspector. The report inspector will open to show you the available options. Make any changes necessary, then click "Save" to record the changes or "Cancel" to discard them.

Interpret the report
The report's name and type are shown at the top of the report. The date range used for the report follows. Three charts and a table are displayed below: a pie chart showing your expenses by category, a pie chart showing your income by category, a bar chart showing your spending habits over time, and a table detailing your income and expenses by category.
Expenses and Income By Category:

These are pie charts depicting your expenses and income over the period of time covered by the report - expenses are on the left and income is on the right. Each pie slice represents the total value of a particular category or transfers associated with a particular account, and the slices are drawn proportionally so that you can see which items comprise a larger portion of your cash flow.
Below each chart is a key that shows which colors correspond to which categories/accounts and the total value of each item. Mouse over any category or account name to highlight the corresponding slice in the pie chart above. Click on any pie slice to "drill down" and see more detail. If you click on a category that contains sub-categories, iBank will show you an income & expense report for that category and its sub-categories. If you click on a category with no sub-categories, iBank will show you a detailed list of the transactions that comprise that category (more below). Use the arrow buttons at the top of the report to navigate back and forth as you drill down into the report details.
By default, iBank generates random colors to differentiate slices in the pie charts. If you want iBank to use the colors assigned to your categories, choose iBank > Preferences, click the "Appearance" button, and check "Show category background colors." This will show the category colors in your account registers as well as on pie charts.
Spending Over Time:

This is a bar chart depicting your cash flow over time. Each bar represents the total income and expenses recorded during a portion of the report's full date range. Income for each period is drawn above the horizontal axis; expenses are drawn below it. The black line indicates the total combined income and expenses for each period. Click on a bar to view income and expense pie charts and a category table (see below) for the time period the bar represents.
Income & Expenses by Category:

This is a table detailing your income and expense categories over the time frame specified for the report. The "Category" column lists the category names (and account names, when transfers are included) in alphabetical order and grouped according to their type (income or expense). Sub-categories are grouped under their parent categories, and any funds assigned directly to a parent category are displayed under a sub-category named "Other." The "Amount" column shows the total for each category/account as well as totals for each group. The total displayed at the bottom of the table is your net profit, also known as the "bottom line." Click on the name of any category or account to view a detailed transaction list for that item (more below).
By default, iBank groups categories under "Income" and "Expense" headings based on the total value of each category. To group categories according to their category type instead, choose iBank > Preferences, click "Advanced," and choose "Category Type" under "Organize categories in reports by."
Transaction List:

This is a table detailing the transactions in a particular category or transfers associated with a particular account. Only transactions that are counted in the report are displayed here; other transactions may be recorded in the category or account but fall outside the scope of the report. Transactions are displayed on this report in chronological order and show their dates, status, payees, categories, credit/debit amounts, and account names. A total of all the transaction amounts is displayed next to the category name at the top of the report. Click on a transaction to open a new window showing that transaction in its account register. You may edit the transaction as needed; when you save your changes, the report will be updated automatically.
Print or save a copy of a report
The main report and any of the detailed reports that you can drill down to can be printed simply by choosing File > Print and clicking the "Print" button. The paper size used for the printout can be changed by choosing File > Page Setup and selecting a different setting, but the orientation is restricted to portrait mode (landscape is not permitted).
To save a copy of a report as a PDF file, choose File > Print, then click the "PDF" button and choose "Save As PDF." Enter a name for the new file, choose where you want to save it, and click "Save." You will then have a copy of the report that you can view and print using the Preview application or any standard PDF reader.
You may also export the data from any table on a report to a tab-delimited file. Mouse over the table you want to export, and a button will appear over the top left corner of the report:  Click this button and choose a location where the table data should be saved, then import the file into Microsoft Excel or Apple Numbers to use the data in a spreadsheet.