How do I use the summary pane and mini-graph?
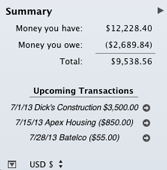
The summary pane appears in the lower left corner of the main window, below the source list. It is designed to provide a summary of your accounts at a glance:

- Money you have: This represents your total assets, i.e. the total amount of cash in your visible accounts and any unrealized gains from your investments.
- Money you owe: This represents your total liabilities, i.e. the total amount of money you owe in credit card, line of credit, loan, and liability accounts, as well as any unrealized losses from your investments.
- Total: This represents your current net worth, determined by subtracting your liabilities from your assets.
The summary pane also lists the next three upcoming scheduled transactions. Click the small arrow button next to one of these to view and edit its details in the main "Scheduled Transactions" list.
Individual accounts can be excluded from the summary pane. Double-click on an account to open the pop-up inspector, then uncheck "Include in total." That account will no longer be included in the calculations for the summary pane, the net worth mini-graph, or net worth figures on the overview report.
To show the net worth mini-graph:

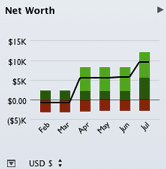
Click the arrow button  at the top right corner of the summary pane to show a miniature net worth bar chart that depicts your net worth over the last six months. Each bar represents the total value of your accounts on today's date in a past month.
Assets are drawn above the horizontal axis in green. The dark green portions represent cash assets (money you have on hand), while the light green portions represent security assets (shares you own that are worth more than what you paid for them). Liabilities are drawn below the axis in red. The dark red portions represent cash liabilities (money you owe), while the light red portions represent security liabilities (shares you own that are worth less than what you paid for them).
To change the currency used for the summary figures:
If you are using multiple currencies, a currency symbol will appear at the bottom of the summary pane. Click this symbol to change the currency used for the figures in the summary pane and net worth mini-graph. Amounts from accounts that use different currencies will be converted automatically using iBank's current exchange rates.
To hide and show the summary pane:
Click the toggle button  at the bottom left corner of the window to toggle the summary pane off and on.