How do I use the overview report?
iBank provides a handy predefined report to summarize the financial activity in all of your accounts. Select "Overview" in the source list and the overview report will appear onscreen:
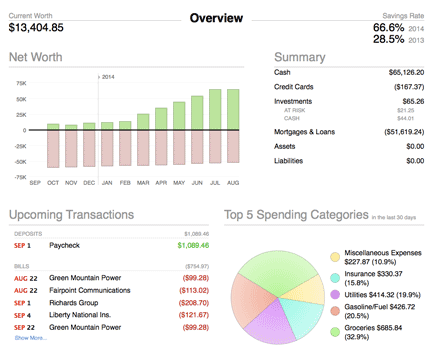
This report, like the account summary reports, is not customizable. To create reports that can be modified for specific purposes, see About Reports.
If you use multiple currencies, the overview report will use the currency that is currently selected in the summary pane at the bottom of the source list. Values are converted automatically using the latest exchange rates.
Exclude accounts from net worth calculations
Although we recommend including all accounts when calculating your net worth, it is possible to exclude accounts if necessary. Double-click an account in the source list to open the account inspector, uncheck "Include in total," then click "Save." The account will not be counted in the calculations for the "current worth," "net worth," and "summary" sections of the overview report, and it will also be excluded from the figures shown in the summary pane.
Limit the report's date range
By default, the overview report takes into account all data recorded in your iBank document. If you happen to know that your financial history before a certain date is incomplete, you may find it helpful to limit the range of the report. Double-click on "Overview" in the source list to open the report inspector, enter a date next to "Begins on," and click "Save." The report will ignore all transactions older than the date entered.
Interpret the report
Current worth
To the left of the report title is shown your current net worth. This figure takes into account the value of all your financial accounts, including assets, liabilities, and the market value of any investments you hold.
Savings rate
To the right of the report title are shown your rate of savings for the current and previous years. Each figure represents the percentage of money you earned during that year and did not spend.
Net worth
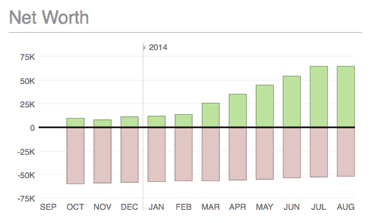
Your monthly net worth is shown here as a bar chart. For each month, the total value of liabilities is shown in red below the x axis, while the total value of assets is shown in green above the x axis. Hover the mouse over a bar to view the month, year, asset amount, liability amount, and net value it represents. The number of months displayed will vary depending on the width of the main window.
Summary
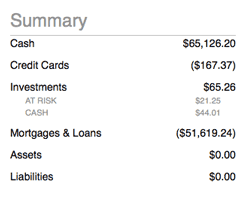
A table is shown here that itemizes your net worth in six groups based on account type:
- Cash: The value of liquid assets held in checking, savings, money market, and cash accounts.
- Credit cards: The value of debt held in credit card accounts.
- Investments: The value of investment and 401k accounts. The total value is shown along with subtotals for the market value of securities "at risk" and cash held in the accounts.
- Mortgages & loans: The value of debt held in loan and line of credit accounts.
- Assets: The value of asset accounts.
- Liabilities: The value of liability accounts.
Upcoming transactions
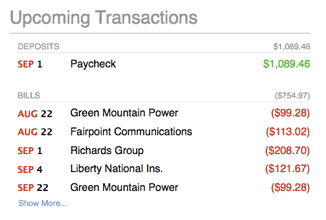
A table of upcoming scheduled transactions is shown here with transactions grouped into deposits, bills, and transfers. The due date, payee, and amount is displayed for each transaction. The report includes all transactions that are due within the current month and next month, but if there are more transactions than space allows, you may need to click "Show More" to reveal them all.
Transfers to loan, credit card, and line of credit accounts are listed under "Bills." All other transfers are listed under "Transfers."
Top 5 spending categories
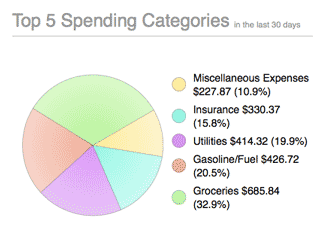
A pie chart is shown here depicting the five categories in which the most spending was recorded during the last 30 days. To the right of the chart, a legend shows the color associated with each category, the total value of the transactions assigned to the category (displayed as a positive number), and the percentage represented by that amount (relative to the five categories shown).
My budget
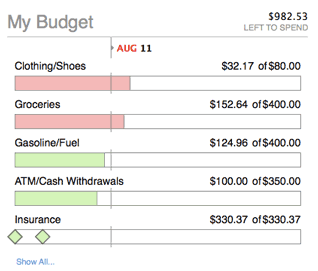
A table is shown here depicting your budget performance during the current month. Budget items are grouped into expenses and income, and each item includes the following details:
- Name: The budgeted category (or account, in the case of a budgeted transfer).
- Actual and expected amounts: The amount you actually earned or spent in the category during the budget period, followed by the amount you expected to earn or spend in the category (including scheduled and unscheduled budget items).
- Progress: A colored progress bar that illustrates the percentage of actual vs. expected spending or earning in the category during the budget period. For income, red indicates that you earned much less than you expected, yellow and orange indicate that you earned somewhat less than you expected, and green indicates that you earned as much or more than what you expected. For expenses, green indicates that you are below or at your expected spending, yellow and orange indicate that you are slightly over what you expected, and red indicates that you spent much more than you expected. Performance for unscheduled items is relative to the current date, so that you can tell whether your earning and spending are on track throughout the month.
Scheduled income and expenses appear as diamonds placed on the bar according to their due dates. Empty diamonds have not been paid yet. For income, red diamonds indicate underpayment and green diamonds indicate on-target or overpayment. For expenses, green diamonds indicate underpayment or on-target and red diamonds indicate overpayment. A vertical line crossing the bar indicates today's date.
If there are more budget items than space allows, click "Show More" to reveal them all. If you use multiple budgets, select your preferred one by clicking "change" and then the name of the budget you want to view.
Top investment moves
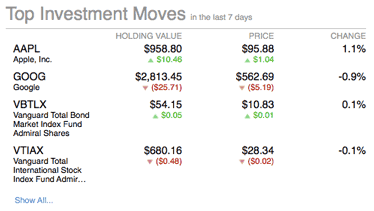
A table is shown here depicting the security positions currently held in your investment and 401k accounts. Securities are listed in order by their total change in value (positive or negative) over the last seven days. For each security, the name and symbol are displayed, followed by the current value of your shares and the change in that value during the last seven days, the current price per share and the change in share price, and the percent change in value. If you hold more securities than space on the report allows, click "Show All" to reveal them all.
Print or save a copy of the report
The overview report can be printed simply by choosing File > Print and clicking the "Print" button. The paper size used for the printout can be changed by choosing File > Page Setup and selecting a different setting, but the orientation is restricted to portrait.
To save a copy of a report as a PDF file, choose File > Print, then click the "PDF" button and choose "Save As PDF." Enter a name for the new file, choose where you want to save it, and click "Save." You will then have a copy of the report that you can view and print using the Preview application or any standard PDF reader.