What are reports all about?
 Reports are where iBank really begins to demonstrate its value. After putting in the time and effort to set up your accounts, enter transactions, and categorize everything, you can use reports to make sense out of all that information quickly and easily. The more meticulously you record and categorize your transactions, the more useful iBank's reports will be in helping you analyze your finances.
With very little setup, you can view breakdowns of your spending habits, see details of all the transactions assigned to a particular category or payee, examine the return on your investments, see how well you have been managing your debts, quickly access tax-related information, and more. Every report can be printed exactly as it appears onscreen or saved to a PDF file for archival purposes.
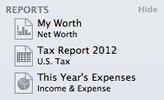
Each report you create is saved and displayed in the "Reports" section of the source list. Mouse over the "Reports" label and click "Show" or "Hide" to toggle the report list visibility. Select one to view that report on the right side of the main window.

Add a new report
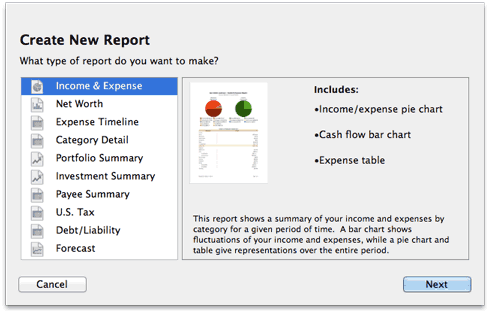
Click the plus (+) button on the toolbar and choose "Add Report," or choose Tools > Add New Report. iBank will ask what type of report you want:

- Income & Expense: Analyze the cash flow in and out of your accounts based on your categories and view a profit & loss statement.
- Net Worth: Compare your assets and liabilities on a balance sheet and graph your wealth over time.
- Expense Timeline: View a monthly breakdown of your income and expenses by category.
- Category Detail: View a table showing the details of your transactions, grouped and subtotaled by category.
- Portfolio Summary: Review market information about your investment portfolio.
- Investment Summary: Analyze your investments in more depth, including capital gains, portfolio diversity, and return on investment (ROI).
- Payee Summary: View income and expense totals for your payees, and see detailed transaction lists for individual payees.
- Categorized Payee: View your payees grouped by category, with income and expense totals for each, and see detailed transaction lists for individual payees.
- U.S. Tax: Analyze tax-related information including income and expense categories and capital gains from your investments.
- Debt/Liability: Analyze the money you owe for loans, credit cards, and other forms of debt (including investments that aren't performing well).
- Forecast: Project your account balances into the future using scheduled transactions.
After you select a report type, click "Next" to configure options for the new report. Click the links above for more information about setting up and using each type of report.
Edit a report
Each report has a number of settings that can be configured to adjust the information displayed on the report. Once a report has been created, double-click its icon in the source list to open the report inspector and modify the report settings. The available options will change depending on the type of report - click the links above for more information about each type.
Delete a report
Select a report in the source list, then choose Edit > Delete. iBank will ask for confirmation before deleting the report.
Use the net worth mini-graph
iBank offers the ability to show a miniature net worth graph at the bottom left corner of the main window. To show it, click the arrow button at the top right of the summary pane to switch to the net worth graph. If you don't see the summary pane at all, click the toggle button  at the bottom of the source list to reveal it. For more information about the summary pane and mini-graph, see Using the Summary Pane.
Topics in this section:
- How do I use the Income & Expense report?
- How do I use the Net Worth report?
- How do I use the Expense Timeline report?
- How do I use the Category Detail report?
- How do I use the Portfolio Summary report?
- How do I use the Investment Summary report?
- How do I use the Payee Summary report?
- How do I use the Categorized Payee report?
- How do I use the U.S. Tax report?
- How do I use the Debt/Liability report?
- How do I use the Forecast report?